As a forex trader, you’re going to need some extra help to understand one of the most volatile financial market in the world. There is only so much you can figure out by looking at the chart on your own. Even the best analysts in the world don’t trade without some assistance. As a beginner, price action indicators can help you asses potential trading opportunities and evaluate them.
Moving Averages–
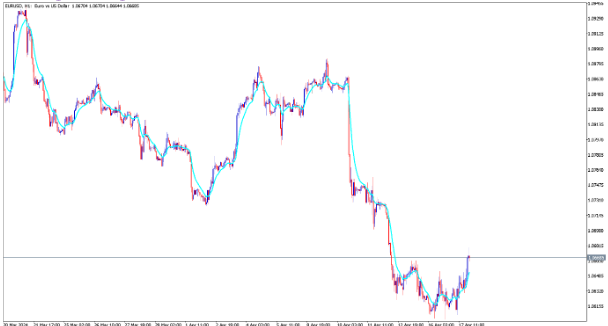
If you’re just getting into using forex indicators, there’s no better place to start than with moving averages. This is one of the most popular indicators, and the best part is that it is already available on most trading platforms. As a beginner, you’ll find that this is one of the easiest indicators to follow.
Simple Moving Averages will help you understand the long-term price action of the market. You’ll
get to see why the market is behaving the way it is over longer periods of time. On the other hand,Exponential Moving Averages or Weighted Moving Averages both focus on current price action
trends in the forex markets.
Bollinger Bands-
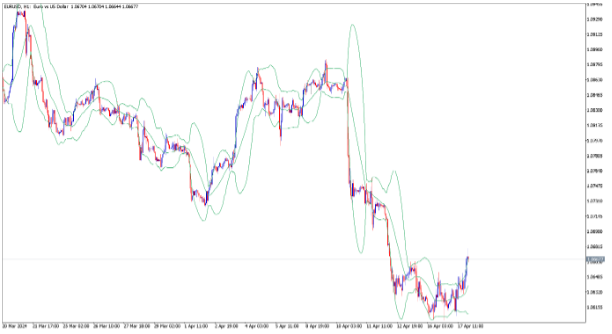
If there’s one thing we know about forex, it’s that the market can be very volatile. Bollinger bands provide us with a visual way to understand the volatility of the price movements, so that we can trade with it, rather than against it. The way this price action indicator works is that it displays three lines or bands. The top and bottom lines are standard deviations. The middle line follows a Simple Moving Average. If the currency pair becomes volatile, the band will expand. Similarly, if it reduces in volatility, the band would contract. This provides us with an accurate visual assessment of a currency pairs range of movement, which can in turn help us initiate more accurate and profitable trades.
Relative Strength Index-
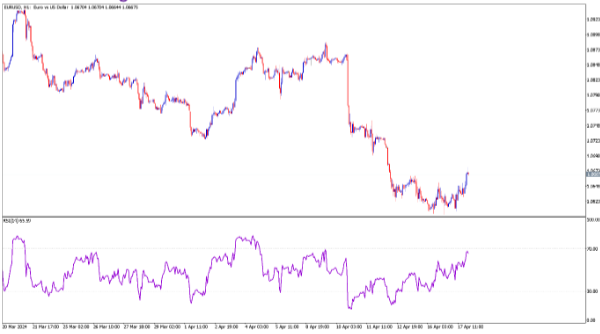
Back when I was a beginner forex trader, I found the Relative Strength Index (RSI) indicator to be my favorite as it was the easiest to understand. This price action indicator is an oscillator and helps traders understand if the currency pair is experiencing overbought or oversold market conditions. An RSI indicator will look like a graph with two points at 70 and 30. If the line passes below the 30 mark, the market is oversold and this could be an optimal time to place a buy order. Alternatively, if the line passes above the 70 mark, the market is overbought and this could be a good time to initiate a sell order.
Average True Range-
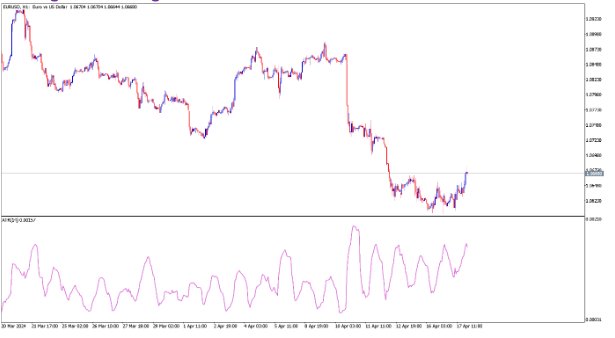
Remember how we talked about Bollinger Bands? The Average True Range Indicator is pretty similar
and is used to measure market volatility. The thing that makes this indicator unique is that it uses range to differentiate between highs and lows in the currency market. The best part is that its range can even be applied to any time period, days, or hours.
This price action indicator includes the current high-to-low period, the previous close to the current high period, and the prior close to current high period. While this may sound tricky, all you need to understand is that the biggest value of the three is the true range, and ATR is the moving average of the true range values.
Stochastic Oscillator-
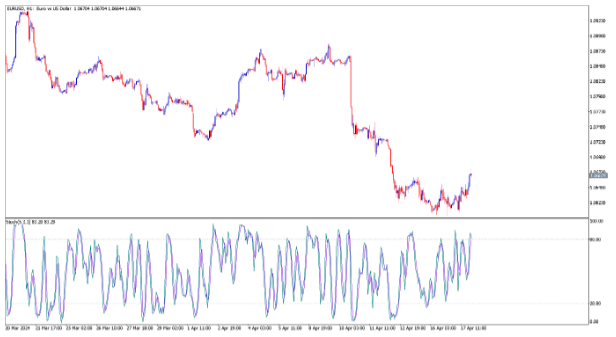
If you’re like me and you like how the RSI indicator works, you’ll definitely love the stochastic oscillator. This is a price action indicator that helps forex traders identify overbought and oversold conditions. As an added bonus, it can also help you identify the market momentum. The way this works is that it measures momentum by comparing the closing price and trading range over a certain period of time. It also helps identify trends that are likely leading to a reversal.
Written by- Alyaziah H. (FOREXtraWealth.com contributor, forex trader, and fact checker for Investing.com)